Master the Markets: Proven Candlestick Pattern Trading Strategies
- Cameren Farr

- Feb 5, 2023
- 4 min read
Candlestick patterns have been used in technical analysis for hundreds of years, originating in Japan in the 17th century. These patterns are created by plotting price movements of an asset over a specified time period and have become a popular tool for traders to analyze the market and make informed trading decisions.

Types of Candlestick Patterns
Japanese Candlesticks
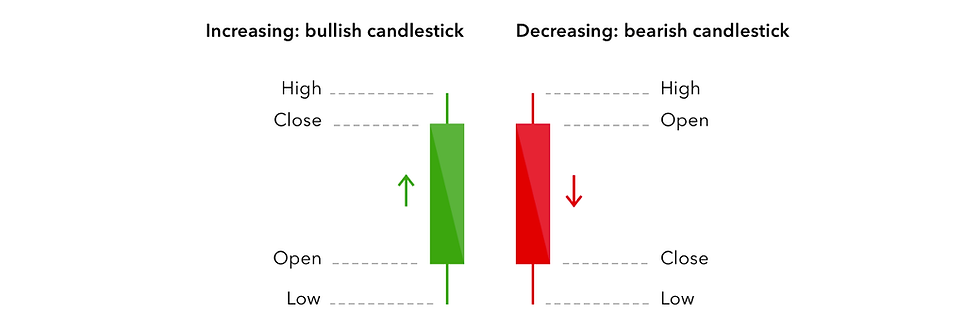
Japanese candlesticks are one of the most widely recognized candlestick patterns and provide a visual representation of price movements over a specified time period. These patterns are comprised of a body, which represents the difference between the opening and closing price, and shadows, which represent the high and low prices for the period.
Hammer Candlestick Pattern
The Hammer candlestick pattern is a bullish reversal signal and is formed when the body of the candlestick is at the upper end of the trading range and the lower shadow is at least twice the length of the body. This pattern indicates that although the price fell during the period, buyers stepped in and pushed the price back up.
Shooting Star Candlestick Pattern
The Shooting Star candlestick pattern is a bearish reversal signal and is formed when the body of the candlestick is at the lower end of the trading range and the upper shadow is at least twice the length of the body. This pattern indicates that although the price rose during the period, sellers stepped in and pushed the price back down.
Engulfing Pattern
The Engulfing pattern is a two-candle reversal pattern that is formed when a small body of one candlestick is completely engulfed by the body of the next candlestick. This pattern can be either bullish or bearish depending on the direction of the engulfing.

Morning Star Pattern
The Morning Star pattern is a bullish reversal signal that is formed over three candles. The first candle is a long red candle, followed by a small candle, and then a long green candle that engulfs the small candle. This pattern indicates a possible trend reversal from bearish to bullish.
Candlestick Pattern Interpretation
Interpreting candlestick patterns requires a basic understanding of market psychology. The patterns are created by the interaction of buyers and sellers in the market and provide a visual representation of the battle between bulls and bears. By analyzing the patterns, traders can get an idea of the market sentiment and make informed trading decisions.
Candlestick Pattern Recognition
Recognizing candlestick patterns is an important skill for traders, as it allows them to quickly identify potential signals in the market. The patterns discussed in this article are some of the most widely recognized patterns, but there are many others that traders can learn and use in their analysis. It is important to note that candlestick patterns should never be used in isolation, but should be used in conjunction with other technical analysis tools and market data.
Candlestick Pattern Signals
Candlestick patterns provide signals to traders, indicating potential trend reversals or continuation. The Hammer and Shooting Star patterns, for example, provide bullish and bearish reversal signals, respectively. The Engulfing and Morning Star patterns can also provide signals for potential trend reversals. It is important for traders to understand the context of the signals, such as the overall trend and market conditions, before making any trading decisions.
Candlestick Pattern Trading Strategies
Candlestick patterns are not only visually appealing but they can also provide valuable insights into market trends and help traders make informed investment decisions. To effectively utilize candlestick patterns, it is important to develop a trading strategy that incorporates these patterns into the decision-making process.
One common trading strategy is to look for confirmation from other technical indicators. For example, a trader may look for a bullish candlestick pattern, such as a hammer or a bullish engulfing pattern, to appear on the chart and then confirm the signal with a positive crossover from the Moving Average Convergence Divergence (MACD) indicator. This helps traders filter out false signals and increase the accuracy of their trades.

Another strategy is to use candlestick patterns in conjunction with support and resistance levels. A trader can look for a reversal pattern, such as a shooting star or a bearish reversal, to form near a key resistance level and then enter a short position. This can also help traders limit their risk as they can set stop-loss orders at key support levels.
Traders can also use candlestick patterns to identify trends and trade in the direction of the trend. For example, a trader may look for a series of bullish or bearish patterns, such as bullish or bearish harami, to appear on the chart and then enter a trade in the direction of the trend. This strategy is particularly useful for traders who have a medium to long-term time horizon.
Candlestick patterns can also be used in combination with other technical indicators to identify potential trades. For example, a trader may look for a bullish candlestick pattern, such as a morning star, to appear on the chart and then confirm the signal with a positive crossover from the Relative Strength Index (RSI) indicator. This helps traders filter out false signals and increase the accuracy of their trades.
It is important to note that candlestick patterns are not a perfect tool and should not be relied upon solely for investment decisions. They should be used in conjunction with other technical and fundamental analysis tools to provide a comprehensive view of the market.

In conclusion, candlestick pattern trading strategies can provide valuable insights into market trends and help traders make informed investment decisions. To effectively utilize candlestick patterns, it is important to develop a trading strategy that incorporates these patterns into the decision-making process and to use them in combination with other technical and fundamental analysis tools.
Whether it is stock options, forex, or cryptocurrency, learning how to trade can be overwhelming for beginners and for experienced traders. Learning all of the components that make you a great trade takes time and it can seem a bit boring. All traders know that learning trading patterns and candlesticks is imperative to understand the markets. To spice up your learning curve on patterns and candlesticks, we have created this one of a kind coloring book that makes studying and memorizing patterns and candlesticks fun and very effective.


Comments